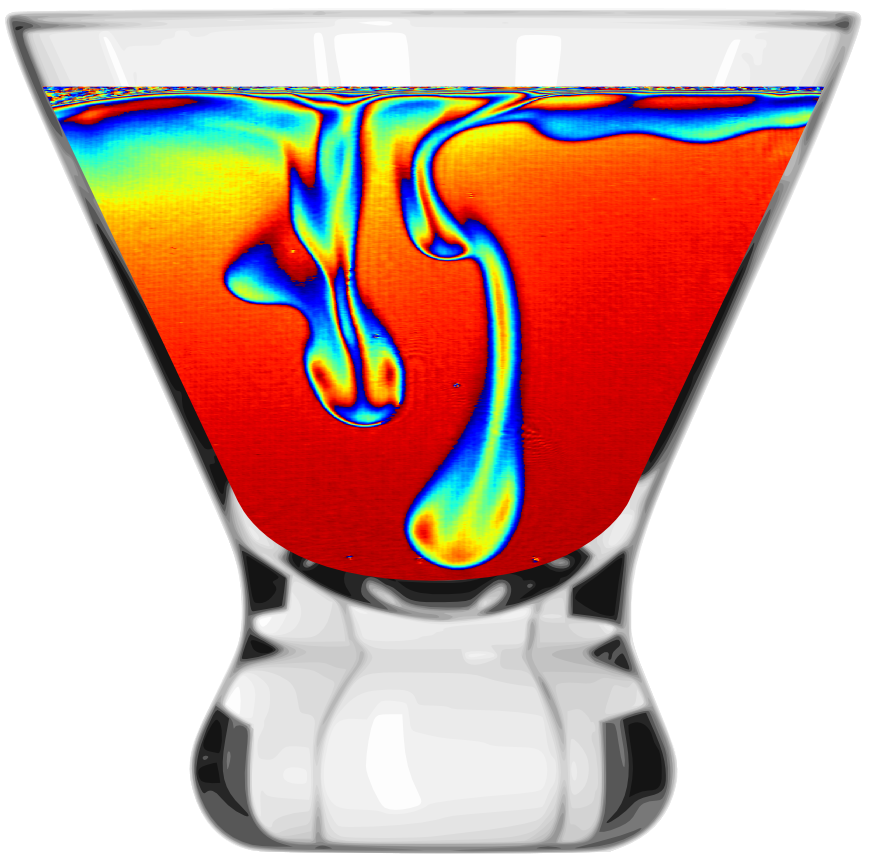
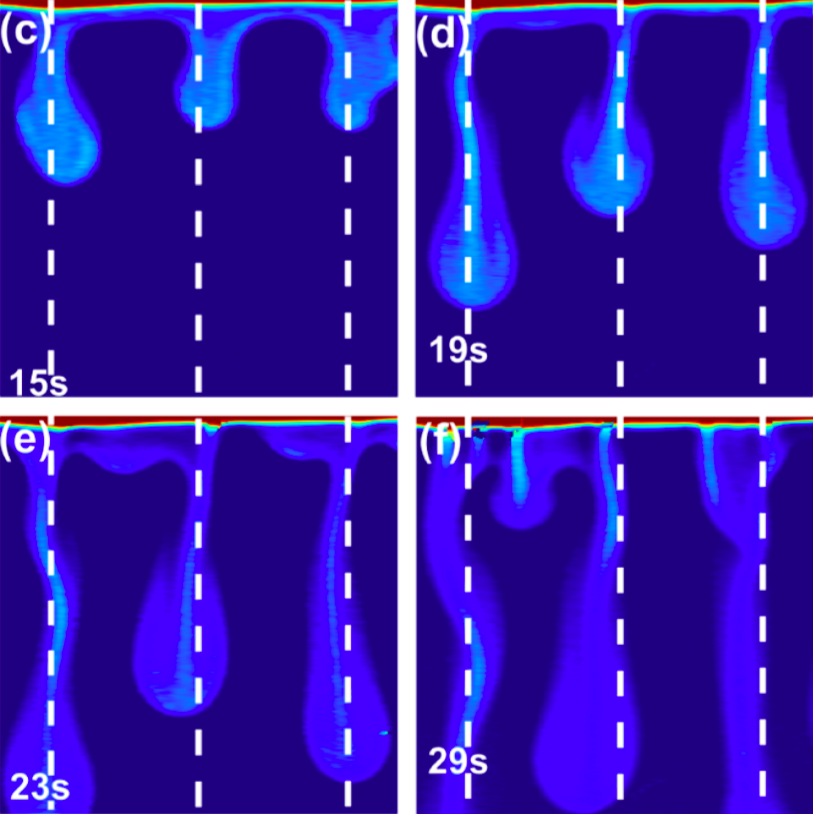
When a mixture of water and ethanol evaporates, a heavy water-rich layer forms at the interface. This becomes unstable and leads to the falling plumes shown here. More information can be found at http://bit.ly/2aTewXI .
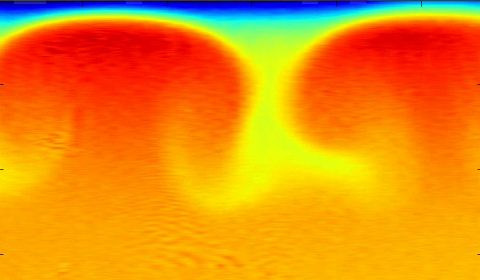
When Co2 is put in contact with an initially quiescent aqueous solution of NaHCO3 and Na2CO3, chemo-hydrodynamical instabilities appear in the liquid phase below the interface as seen in the image. This is due to an unstable zone in the boundary layer, which appears when the diffusion speed of the generated product and the consumed reactant is different. More details on these experimental measurements can be found at http://bit.ly/2aCYEbw .
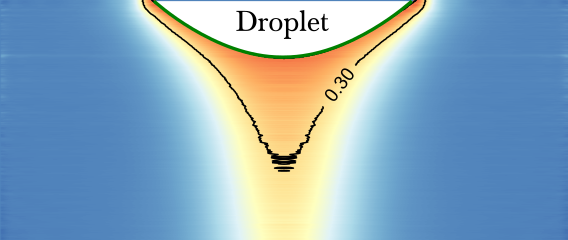
The vapour cloud surrounding an evaporating pending liquid droplet into an inert gas has been visualised and quantified using interferometry. This resulted in the falling chimney-like shape shown here. This is due to natural convection as the generated vapour phase is up to 4 times heavier than the surrounding air in this case. Extracting the mole fraction and it normal gradient at the interface we have also been able to measure the interfacial temperature profile and even the local evaporation rate. More information on these measurements can be found at http://bit.ly/2ayMU6a
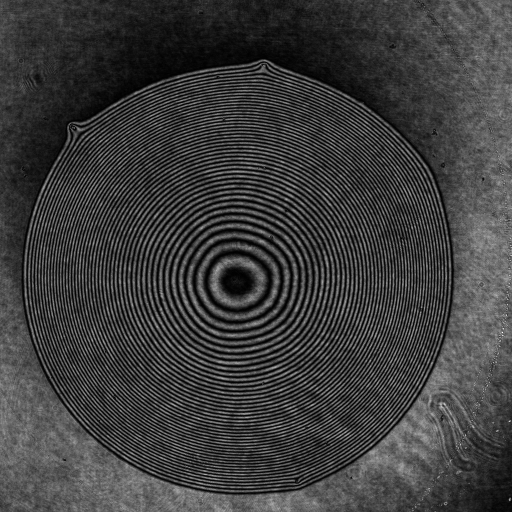
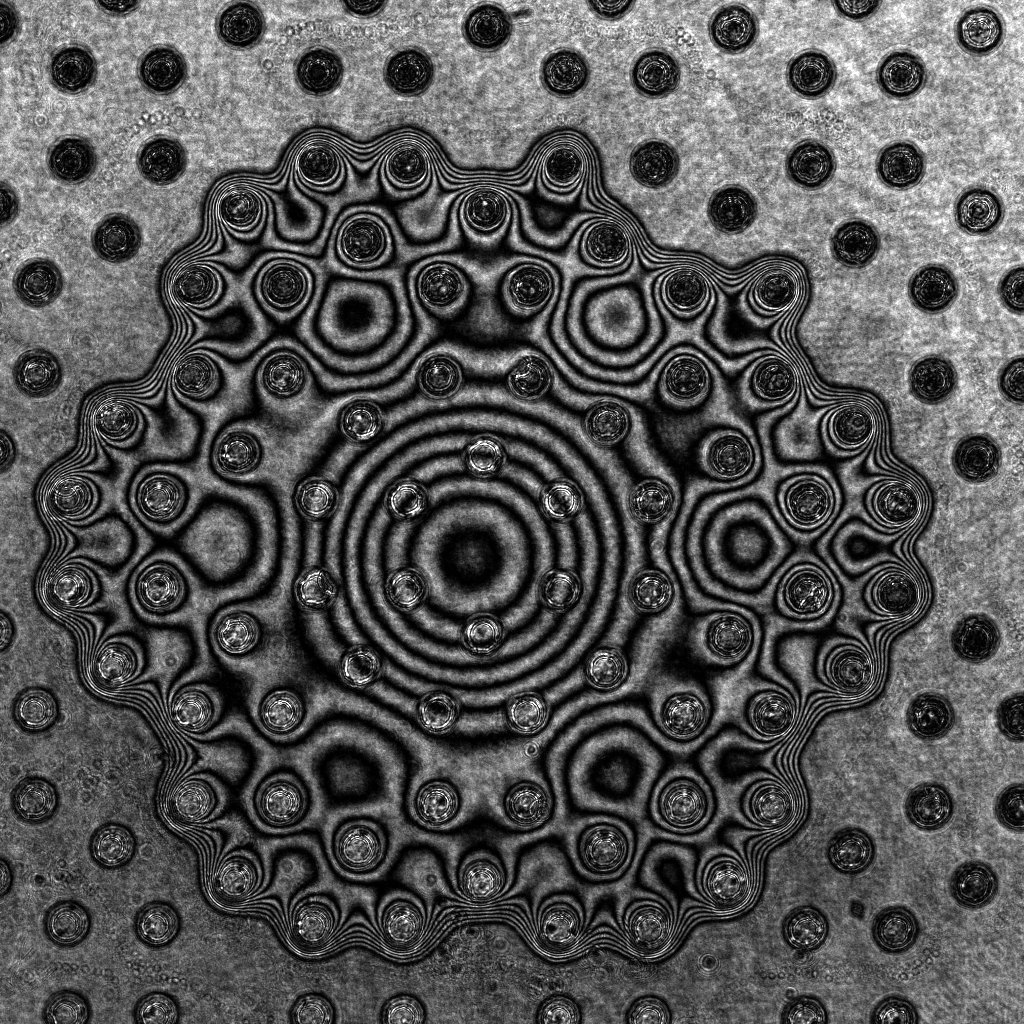
This interferometric image of an evaporating droplet is similar to a height map, where each black contour line indicates a certain height and the height difference between two black lines is about 2.5µm. Thus, using advanced image processing algorithms, we are able to reconstruct the entire profile of these evaporating droplets. This allows us to perform a precise analysis of perfectly wetting liquids and the effect which Marangoni flows inside such droplets have on their profile. Publications on our wavelet-based image processing algorithms and the results of the Marangoni-induced shape deformations can be found here: http://bit.ly/29HGKAM
When a droplet is deposited on a substrate prepatterned through lithography with small pillars arranged in a particular pitch, the resulting droplet can be deformed to some interesting shapes.
This work dealt with the experimental characterization of carbon dioxide (CO2) absorption in an aqueous solution of N-(2-hydroxyethyl)piperazine, by using Mach-Zehnder interferometry. This method enabled visualizing the phenomena taking place in the vicinity of the gas–liquid interface. Thanks to a calibration, the obtained results could be transformed into the time evolution of the CO2 loading field in the aqueous solution and the gas–liquid absorption rate for various operating conditions. A phenomenological model, highlighting the limiting steps of the gas– liquid CO2 absorption, was proposed. A set of experiments was realized and the parameters of this model were estimated for various initial amine concentrations and initial loadings. The results were discussed and correlations were proposed for the model parameters.